Advanced Data Visualizations of Forest Inventory Data
The goal of this collaborative project is to develop a suite of interactive maps and visualizations of data collected via the Forest Inventory and Analysis (FIA) program. This is a national program of the USDA Forest Service that conducts a...Overview
The goal of this collaborative project is to develop a suite of interactive maps and visualizations of data collected via the Forest Inventory and Analysis (FIA) program. This is a national program of the USDA Forest Service that conducts and maintains comprehensive inventories of the forest resources in the United States. The FIA unit of the Northern Research Station (NRS-FIA) is responsible for the inventory of nearly 174 million acres of forestland spread across 24 states of the northern United States. As part of that mission, NRS-FIA seeks to improve the public’s access and understanding of forestland trends by designing and publishing interactive data visualizations. This project is part of a partnership between the NRS-FIA and the University and Minnesota to research and develop potential tools and applications to advance toward this goal.
1: Low-Cost, Mobile Virtual Reality (VR) Environments
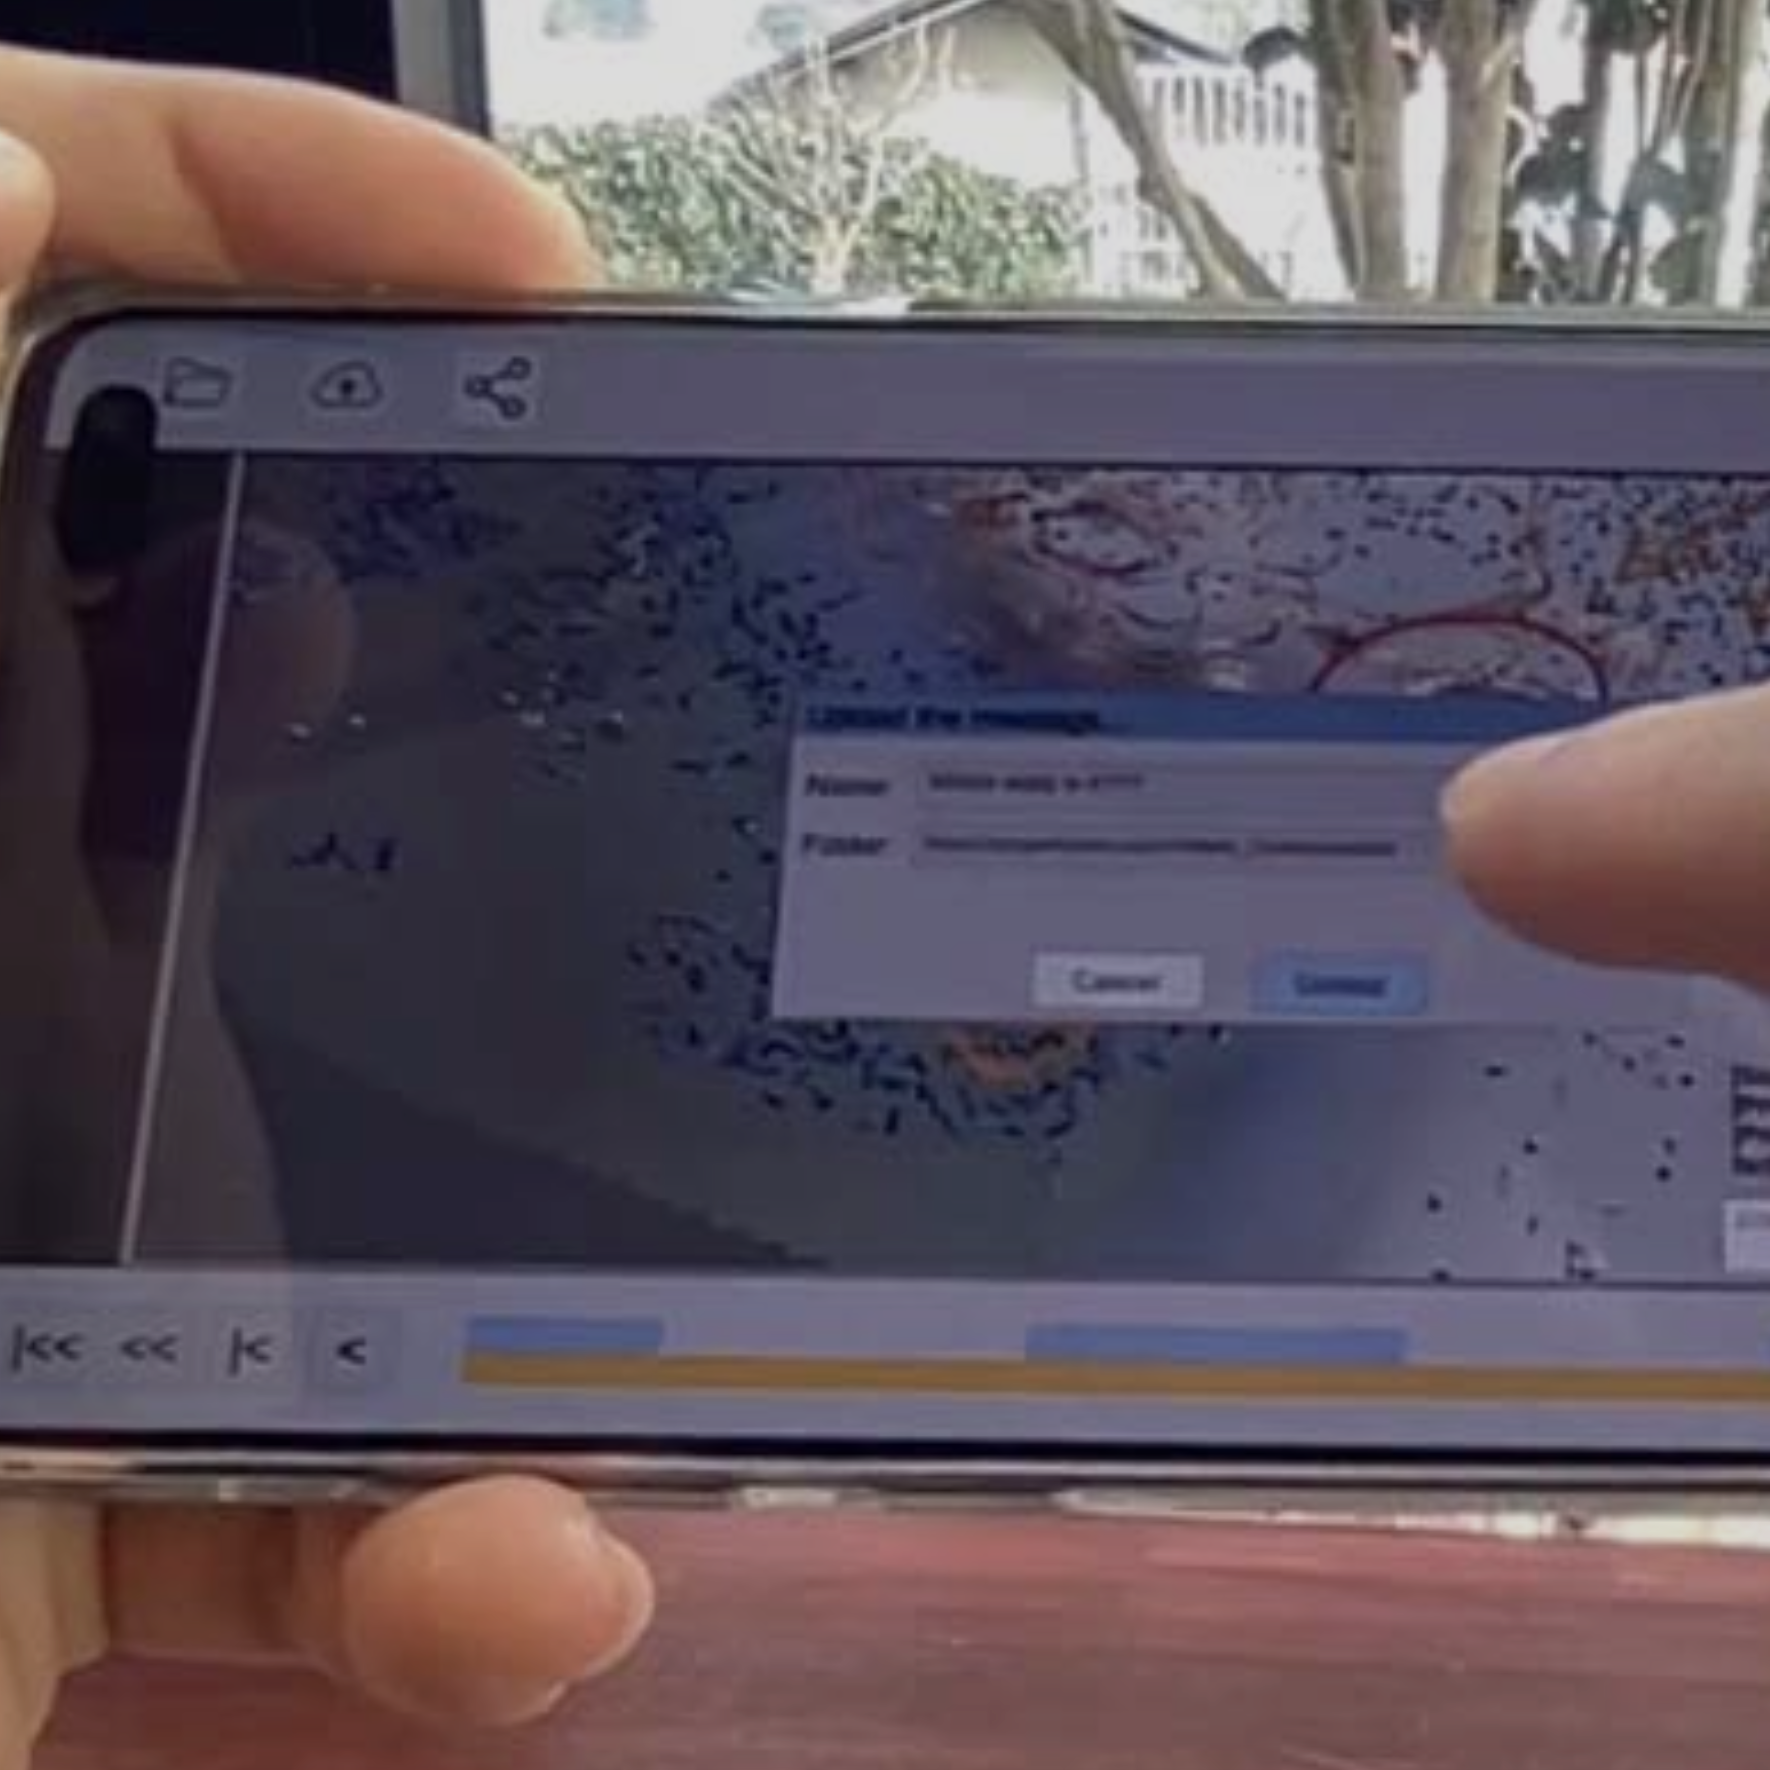
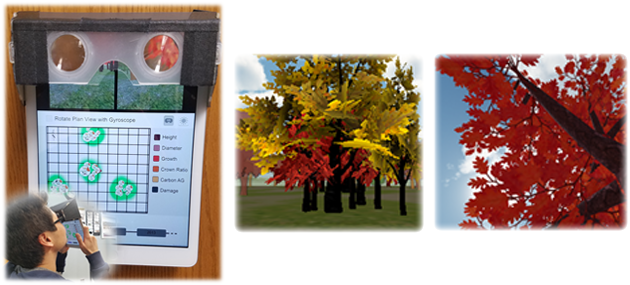
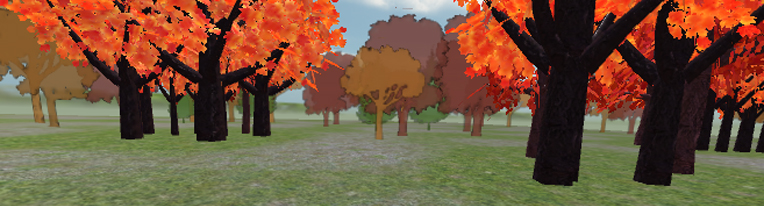
Our first exploration of futuristic visualization platforms that might be used as new dissemination tools for FIA data is based on a low-cost, mobiel VR environment constructed from a tablet. Inspired by the iNVerse low-cost viewer developed at USC's MxR lab in the Institute for Creative Technologies [1], we fitted an iPad with a pair of low-cost lenses that fit over the top third of the screen. This turns the top third of the device into a stereoscopic display. Our software interfaces with the rotational sensors on the iPad to update the display based upon the user's current heading, thereby creating an effective low-cost VR device that users simply hold up to their eyes. What is unusual about this device in part is the fact that the bottom two-thirds of the device can also be used for data visualization, sort of like a clipboard that provides a 3D view when held up to the eyes and a complementary 2D view when held in the hands. Thus, much of our research in this first exploration revolved around designing an effective set of two complementary views of the FIA data, one 2D and one 3D. Following best practices in data visualization, the two views are tightly linked together.
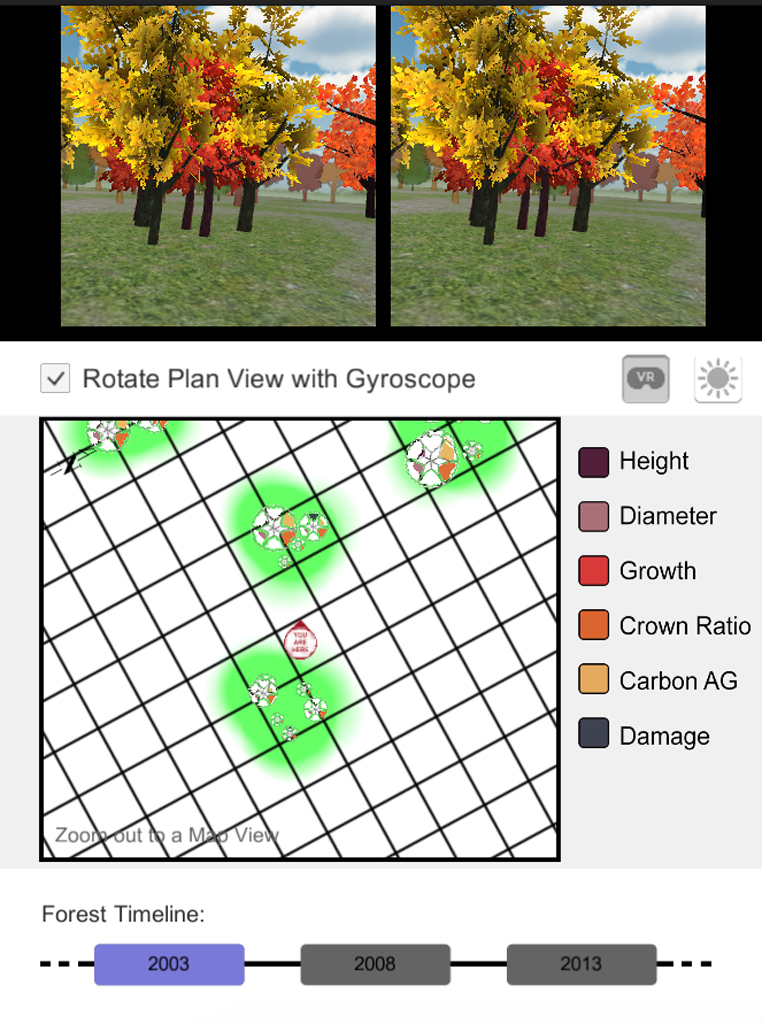
A screenshot from the iPad App is shown above. The FIA data visualized come from three plots in Western Wisconsin. The 2D view at the bottom of the screen is a multivariate visualization. Six variables of interest are visualized in a multivariate glyph for each tree. The 2D Plan View can be rotated, translated, and scaled, and it is possible to zoom into any of the plots. A 3D view of the plot is digitally reconstructed from the FIA plot data based on the current location of the ``YOU ARE HERE'' marker in the plan view.
This is the type of interactive exploratory visualization that we anticipate could be deployed within a classroom setting, where each student would work with his or her own iPad device to complete a lesson plan based on the FIA data.
2: Web-Based 3D Environments
To facilitate a similar style of data exploration but in a scenario where users do not have access to a tablet device, we developed a complementary web-based version of this visualization, which can be viewed at the following link:
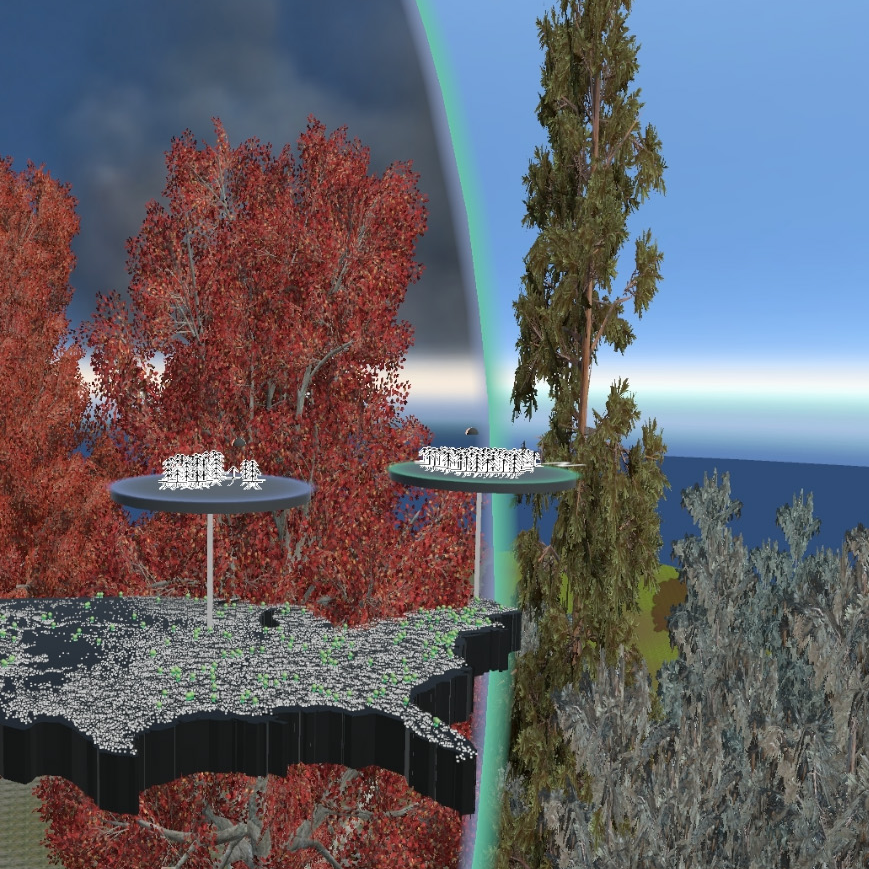
3: High-End VR Environments for Analysis
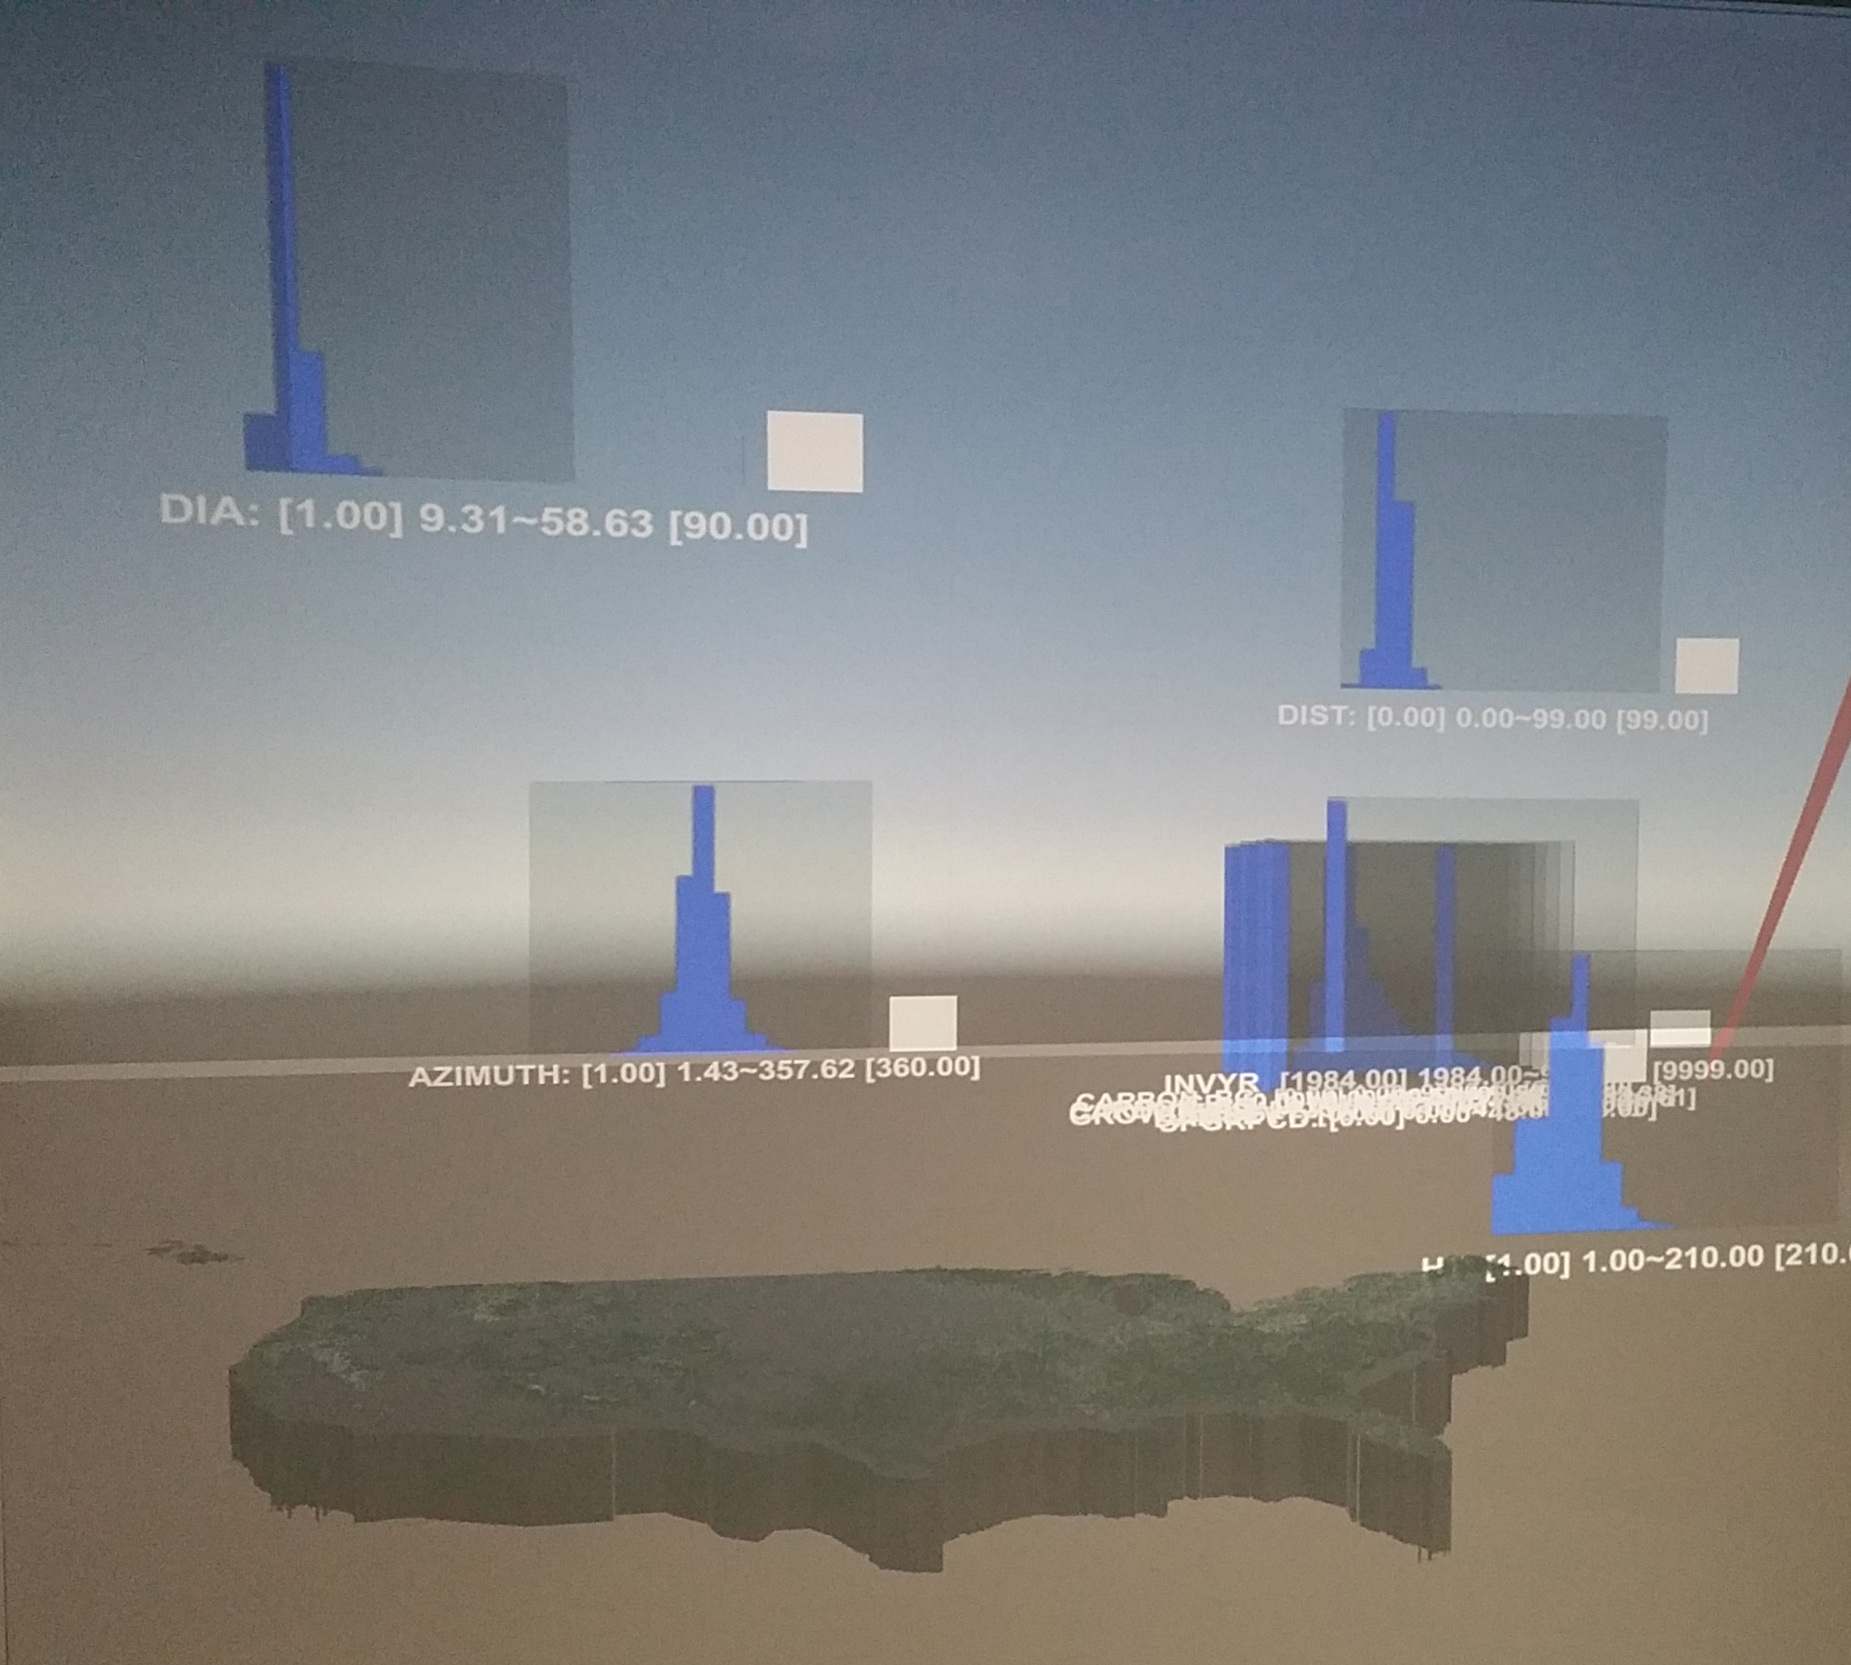
Our third exploration takes a different approach that would be more useful for advanced analysis by FIA scientists. Here, we make use of a high-end CAVE VR environment and extend the visualization to include thousands of plots. The major advances here are scaling up the amount of data being visualized and presenting these data in a form that conducive to analyzing trends.
References
[1] Evan A. Suma, David M. Krum, Todd Richmond, and Mark Bolas. The MxR Lab at the USC Institute for Creative Technologies. Lab Presentations Track at IEEE VR 2015, Arles. France. PDF